Analytics and reports
Cadigence turns the work flowing through it into numbers you can act on. Managers and admins find these under Dashboard (a live snapshot) and Analytics (deeper breakdowns).
The dashboard
Section titled “The dashboard”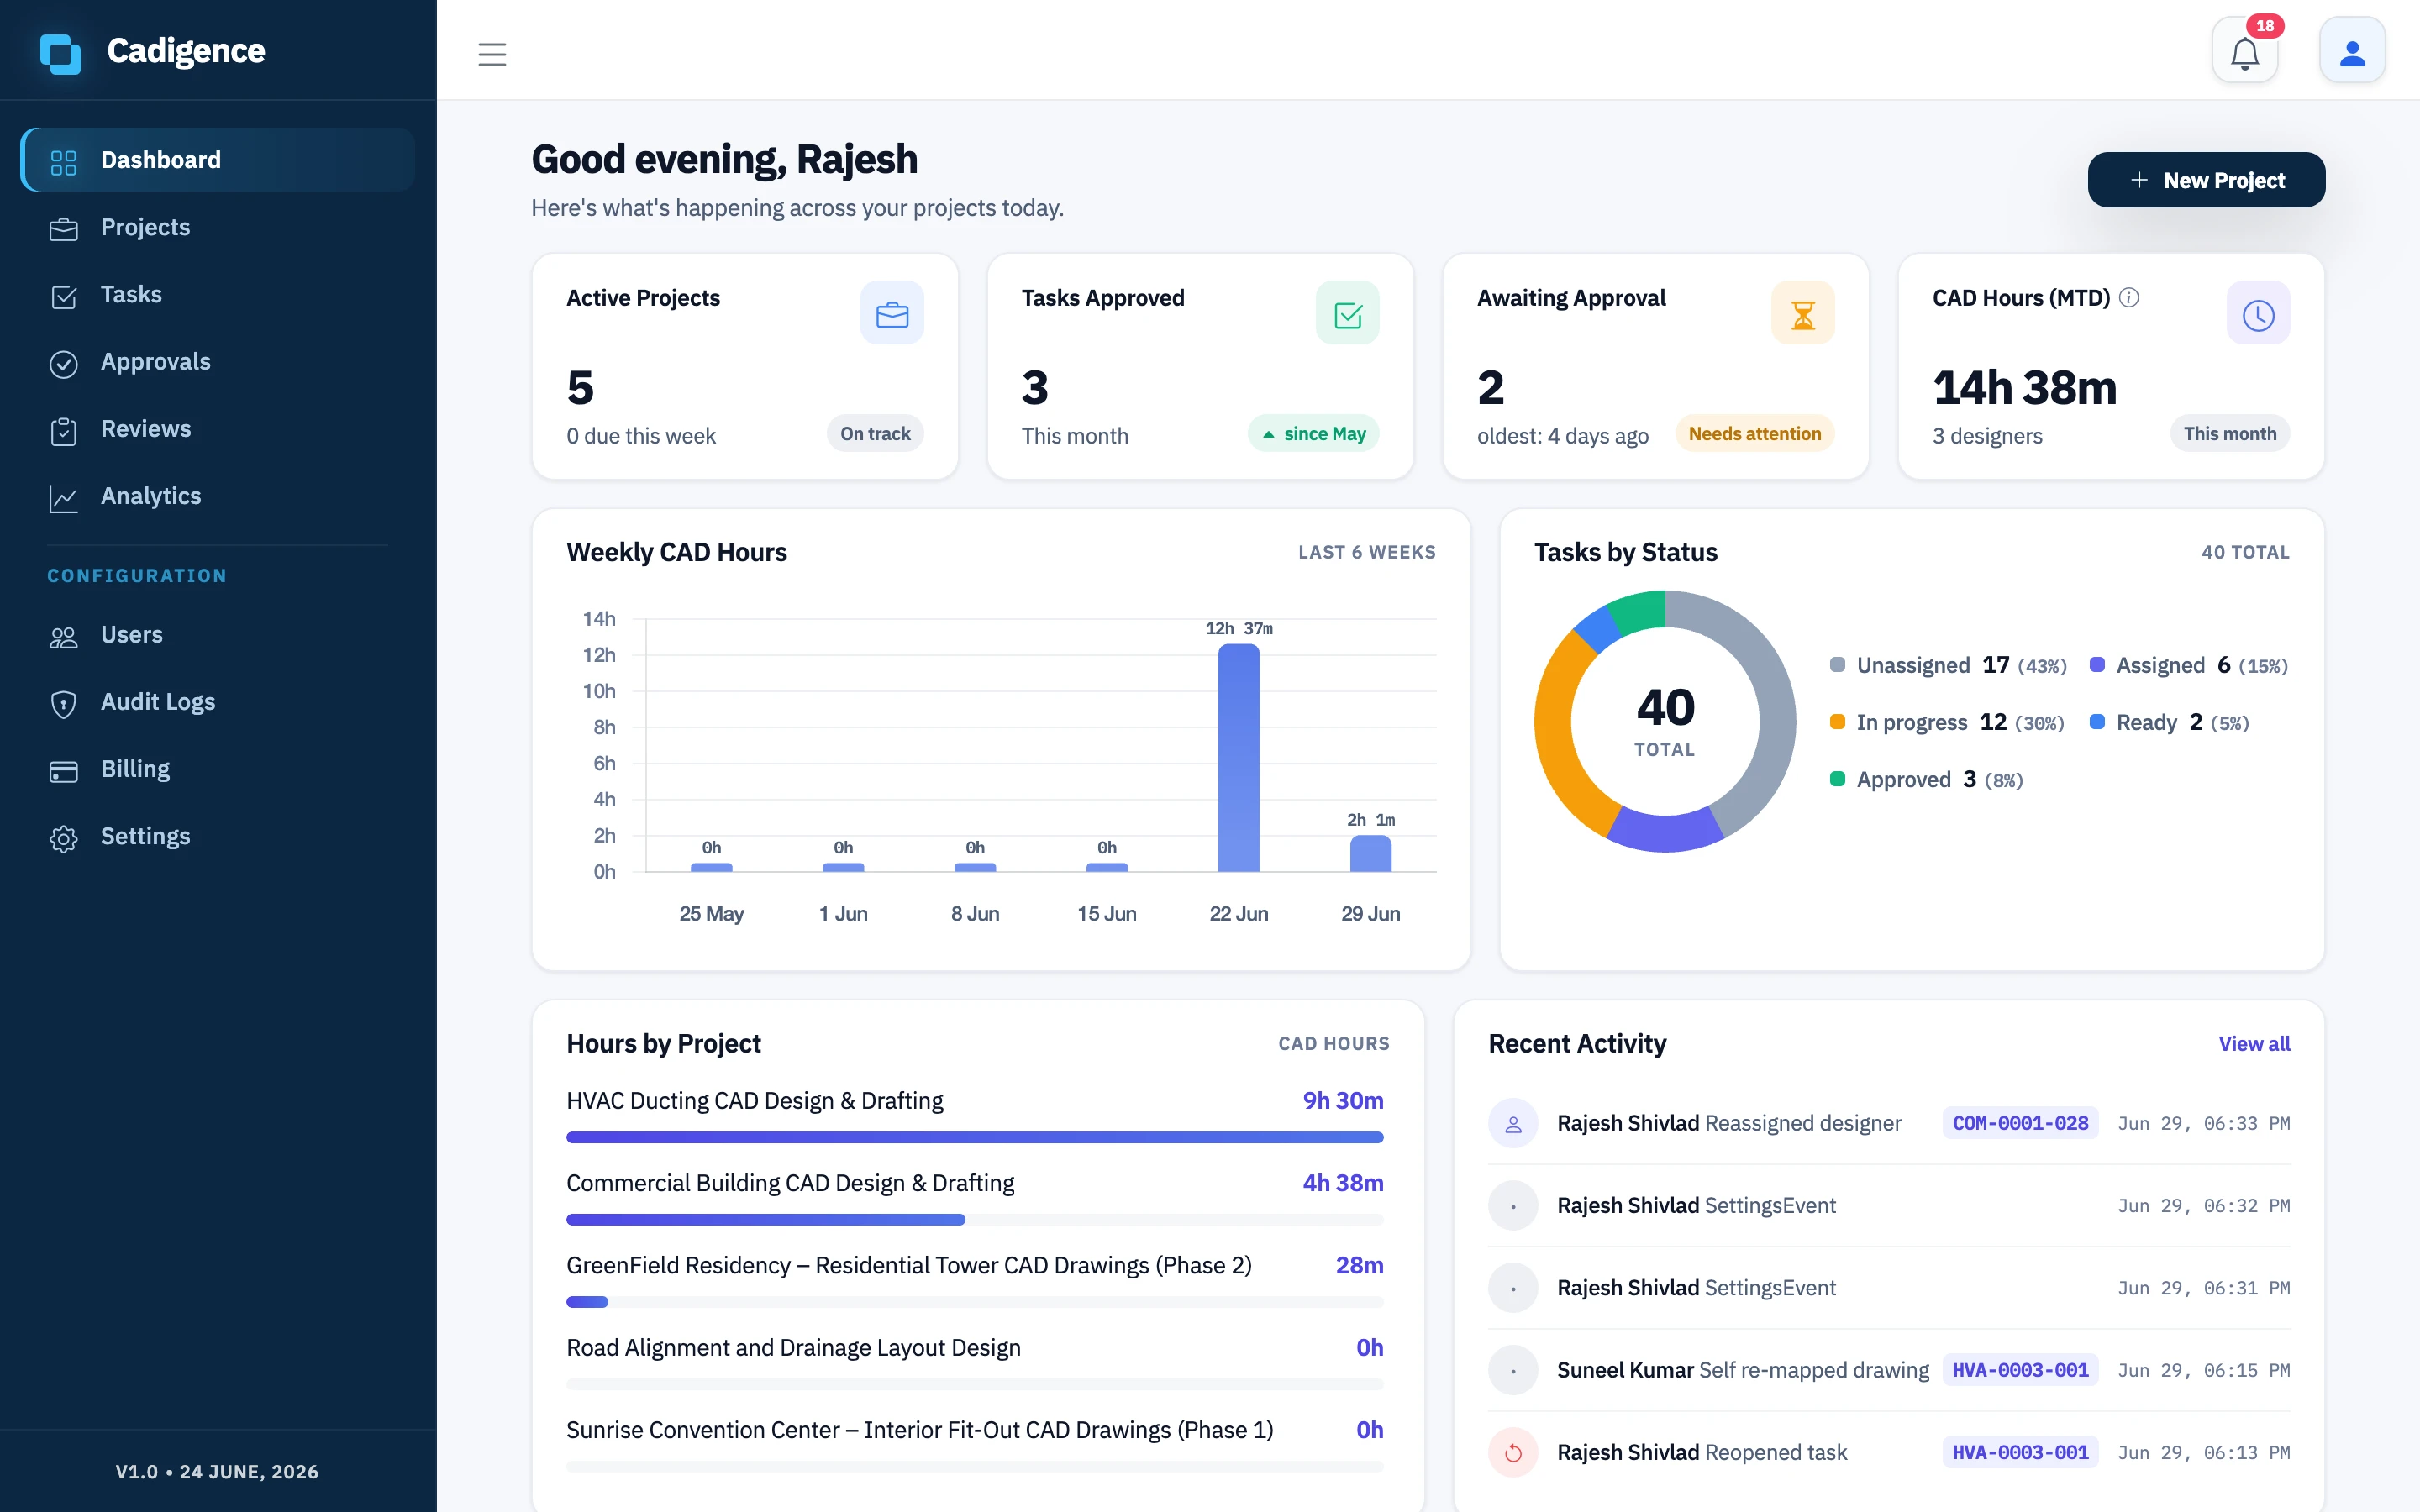
A one-screen snapshot of where things stand:
- Active projects and tasks by status.
- Tasks approved and approvals awaiting you.
- CAD hours this month and a weekly trend.
Analytics metrics
Section titled “Analytics metrics”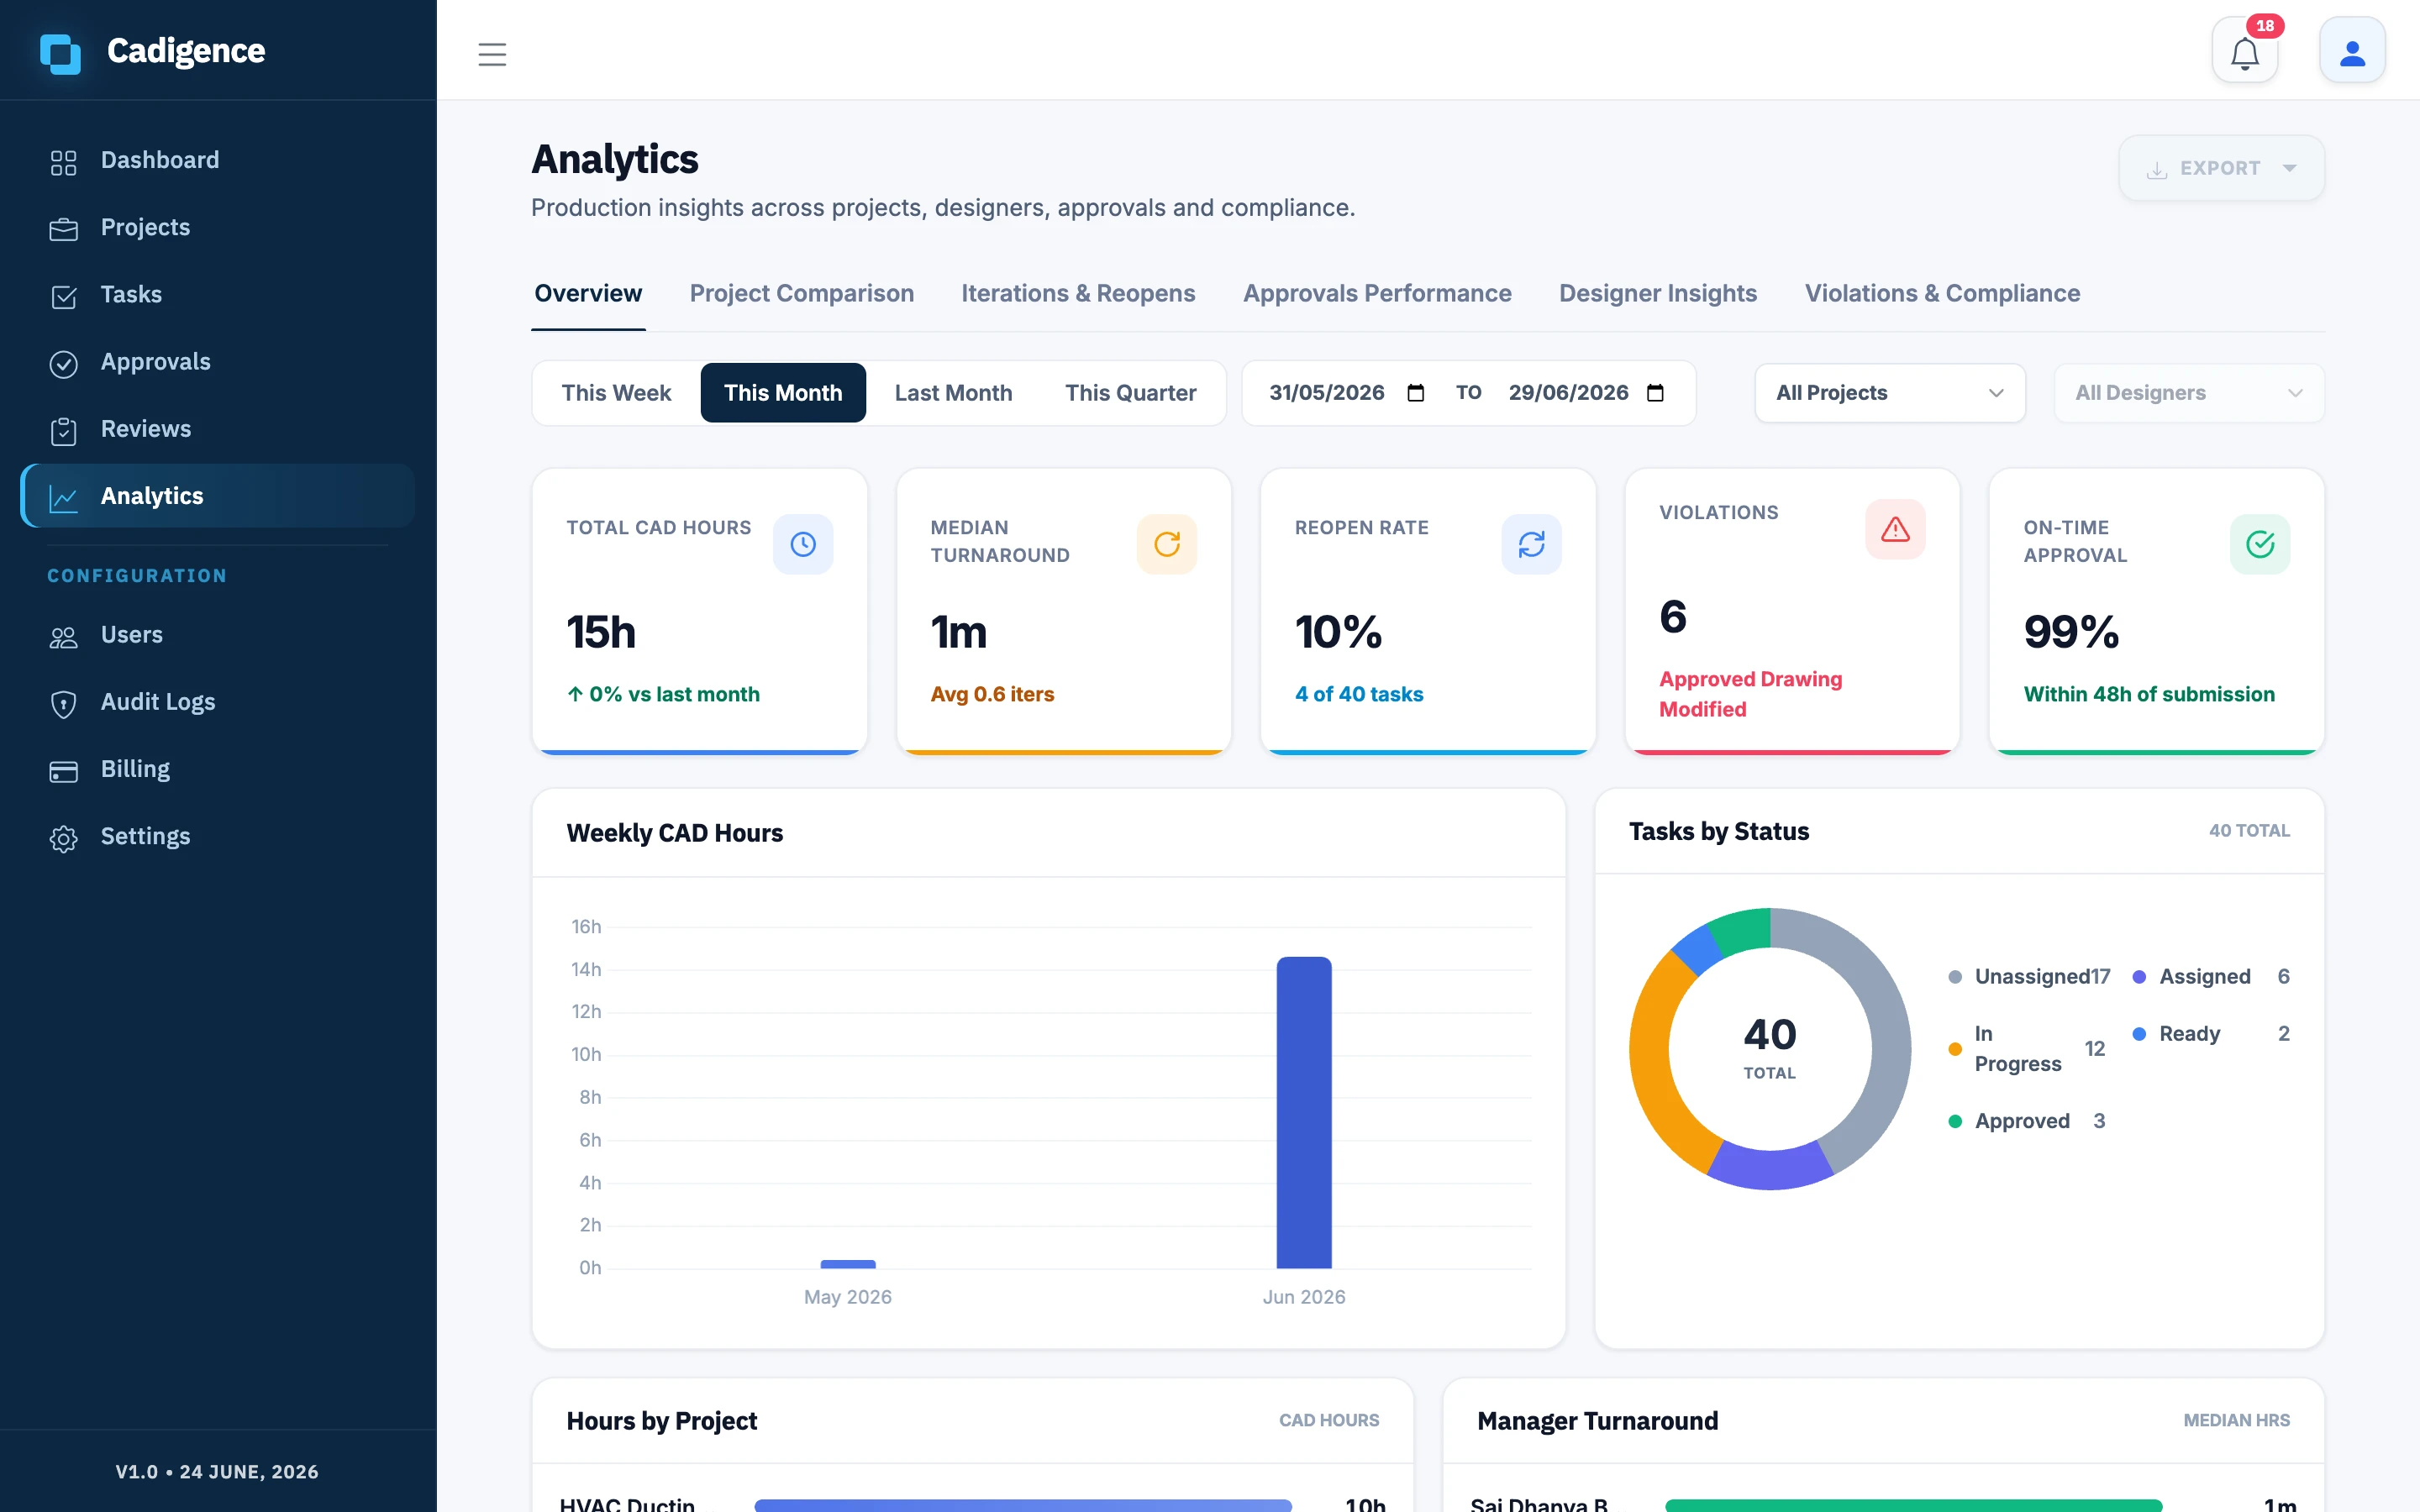
The Analytics screen groups the numbers so you can see what’s working and what isn’t:
- CAD hours: effort by project and by designer.
- Average iterations: how many passes drawings take (lower is better).
- Reopen rate: how often drawings get sent back.
- Approval turnaround: how long reviews take, including a median per reviewer.
- On-time approval: the share of reviews turned around within the target time.
- Violations: flagged changes, broken down by type and designer (see Violations and drawing integrity).
Filter and export
Section titled “Filter and export”- Filter the analytics by date range, client, project, manager, and designer to focus on exactly the slice you care about.
- Export to CSV and Excel for your own reporting, invoicing, or planning.
Use these numbers to quote new work, plan capacity, and spot where rework is creeping in, with real data instead of guesswork.